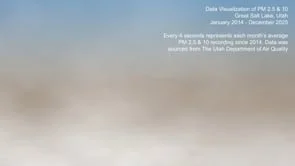
A photograph of the Great Salt Lake comes in and out of view as animated air pollutants (Particulate Matter 2.5 & 10) continuously hover in and out of the landscape. In this animated 10- minute time piece, every 4 seconds renders one month’s average recording of PM 2.5 & 10 sourced from the Utah’s Department of Air Quality’s dataset since 2014. The animation acts as a visual timekeeper of the Anthropocene in local space in time, revealing the continuous harm air pollution has caused upon local ecosystems and human health.
These air pollutants are caused from vehicle exhaust, industrial and household combustions, wildfire smoke, and dried lakebed arsenic dust due to natural geological weathering, climate change, and a century of human industrial activity and historic mining. PM 2.5 & 10 continuously gets trapped in the Salt Lake region due to its natural terminal basin and topographical formation, causing an inversion layer where pollutants cannot readily escape.
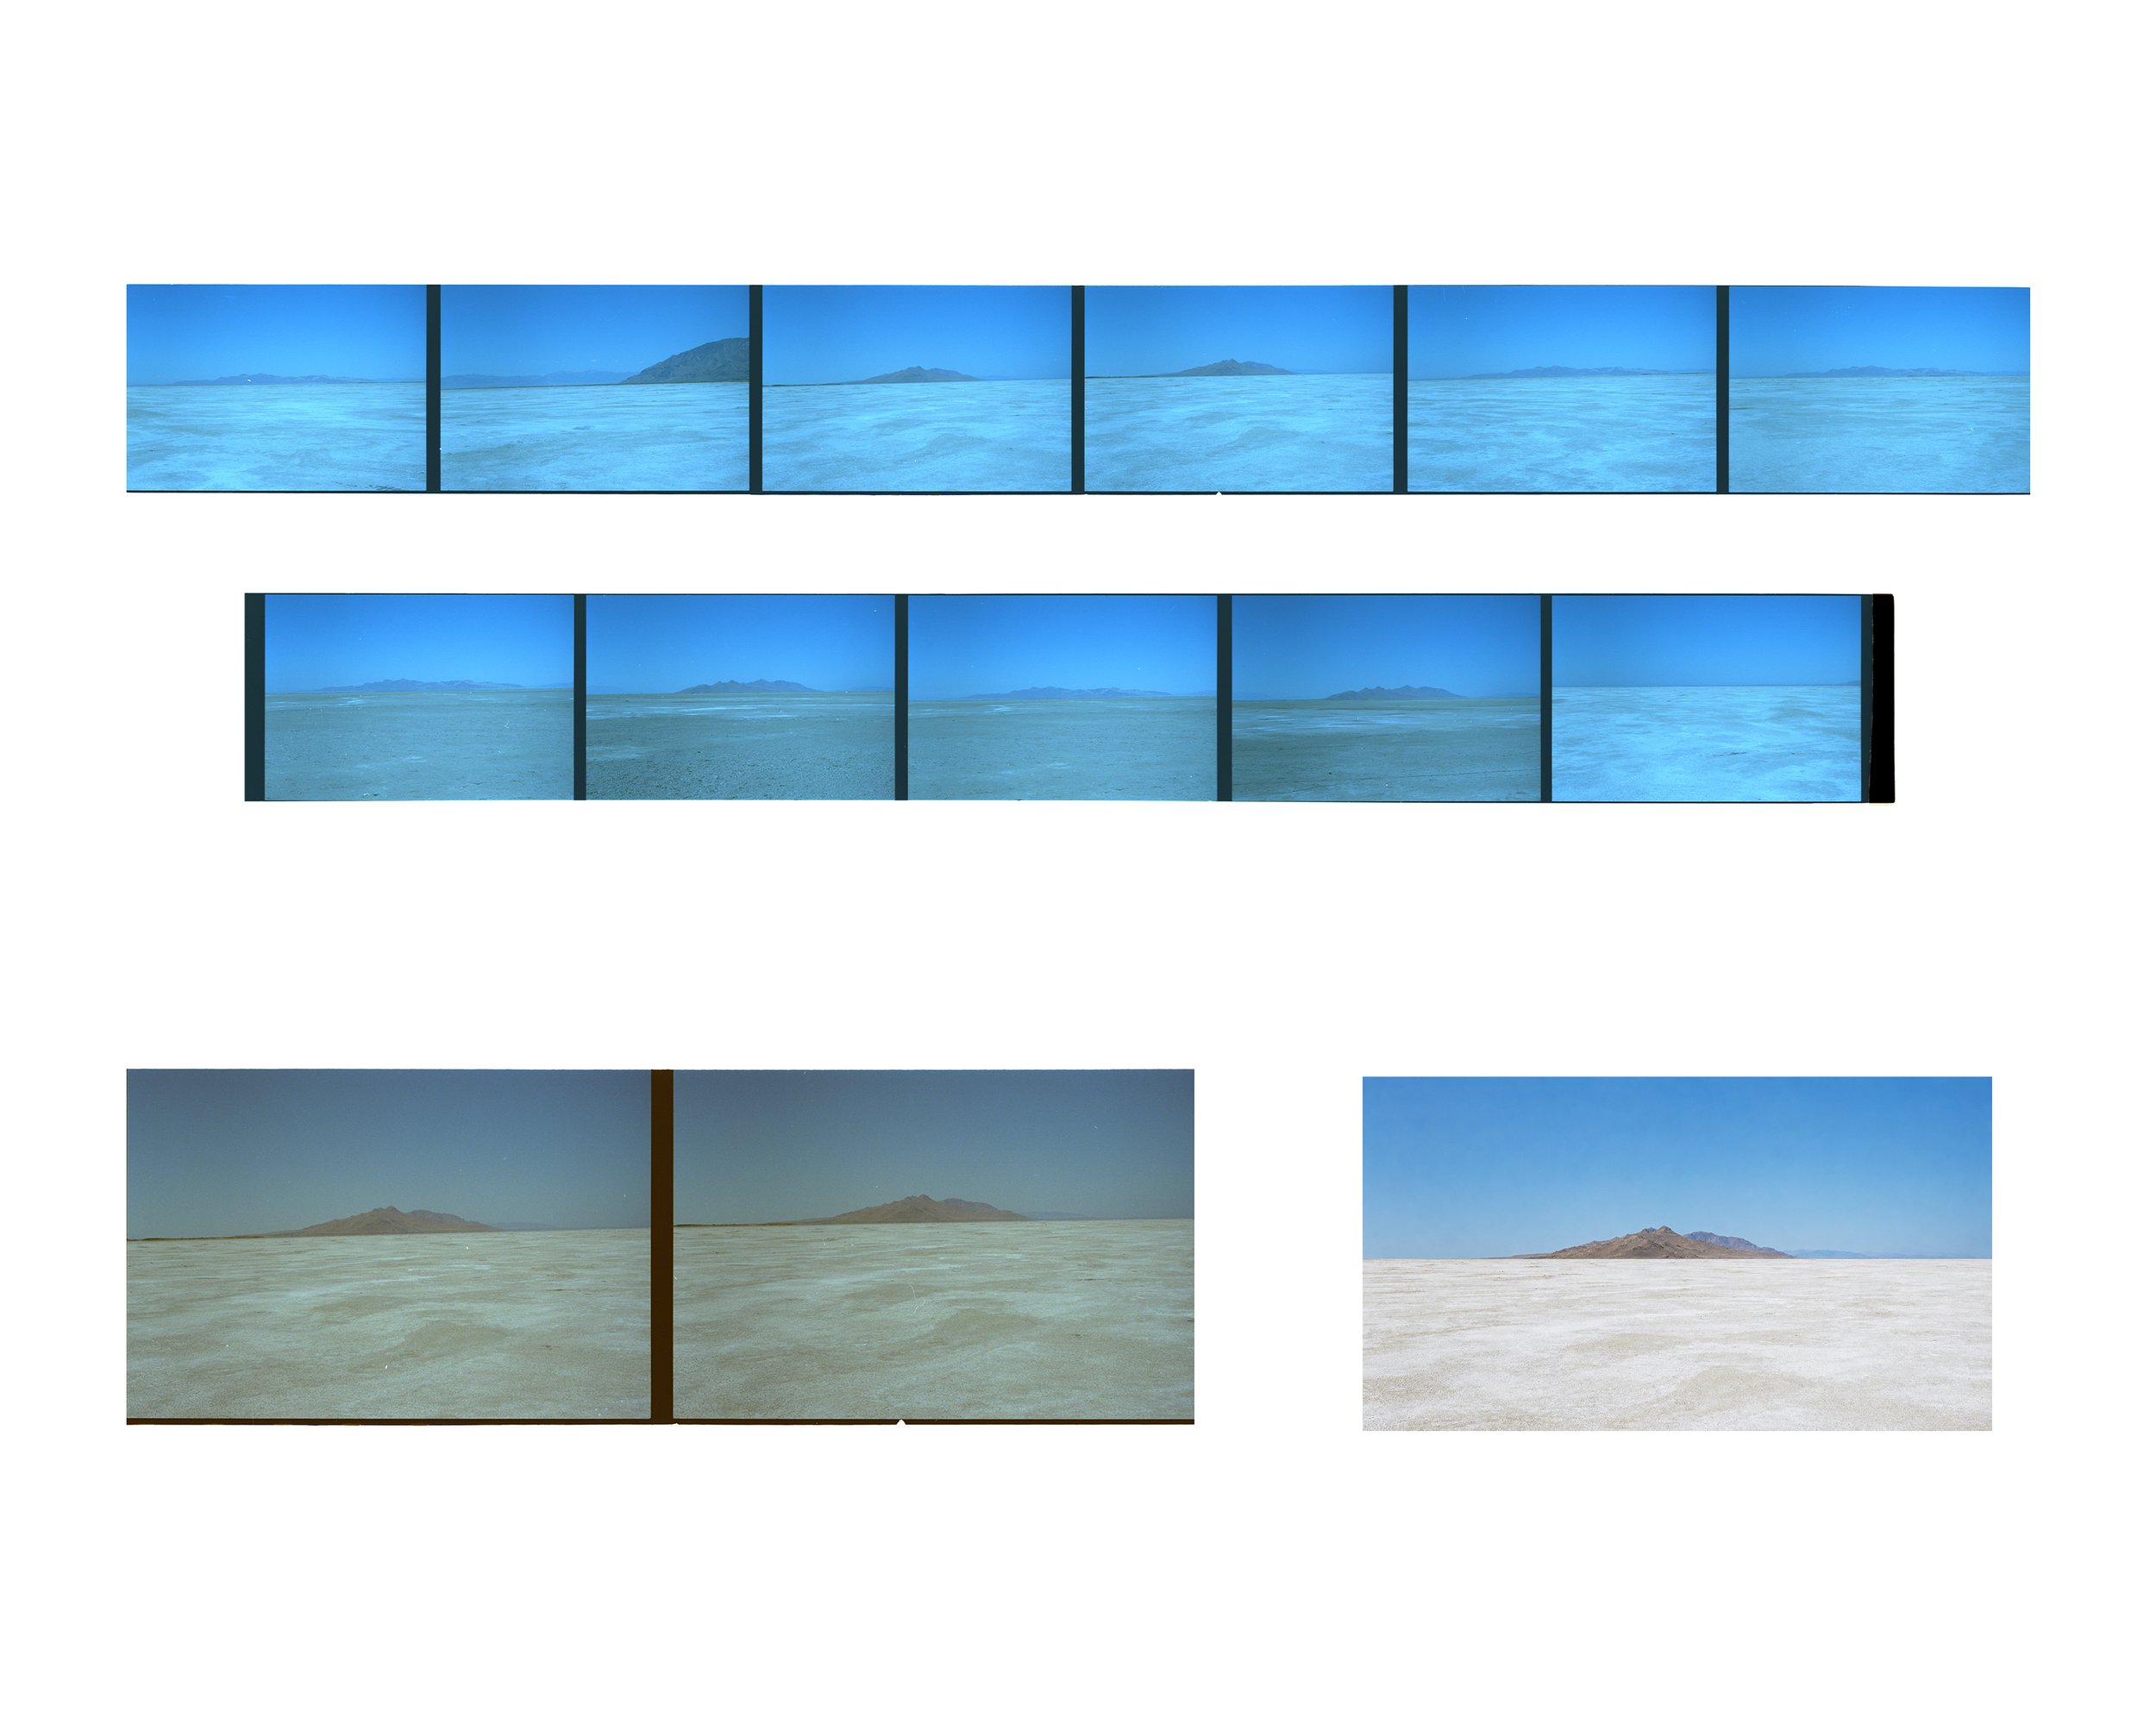
I photographed various compositions around the Great Salt Lake using a 35mm camera on Kodak UltraMax 400. I decided on the Lee Creek Nature Wildlife Preserve as my location due its dynamic ecosystem, consisting of natural area, salt, water, and land that continues to be in constant fluctuation. It has close proximity to the urbanization of Salt Lake City and it also borders the natural drainage site of the Great Salt Lake’s shoreline. For years, the Great Salt Lake has been progressively drying up due to climate change and rising tempters. This photograph is a representation of that evidence and its ecological harm upon both civilization, wildlife, and natural habitats.
In this process image, you can see a small selection of my contact sheets, along with the various color correction techniques I utilized to finalize the chosen background image for my time-based piece.
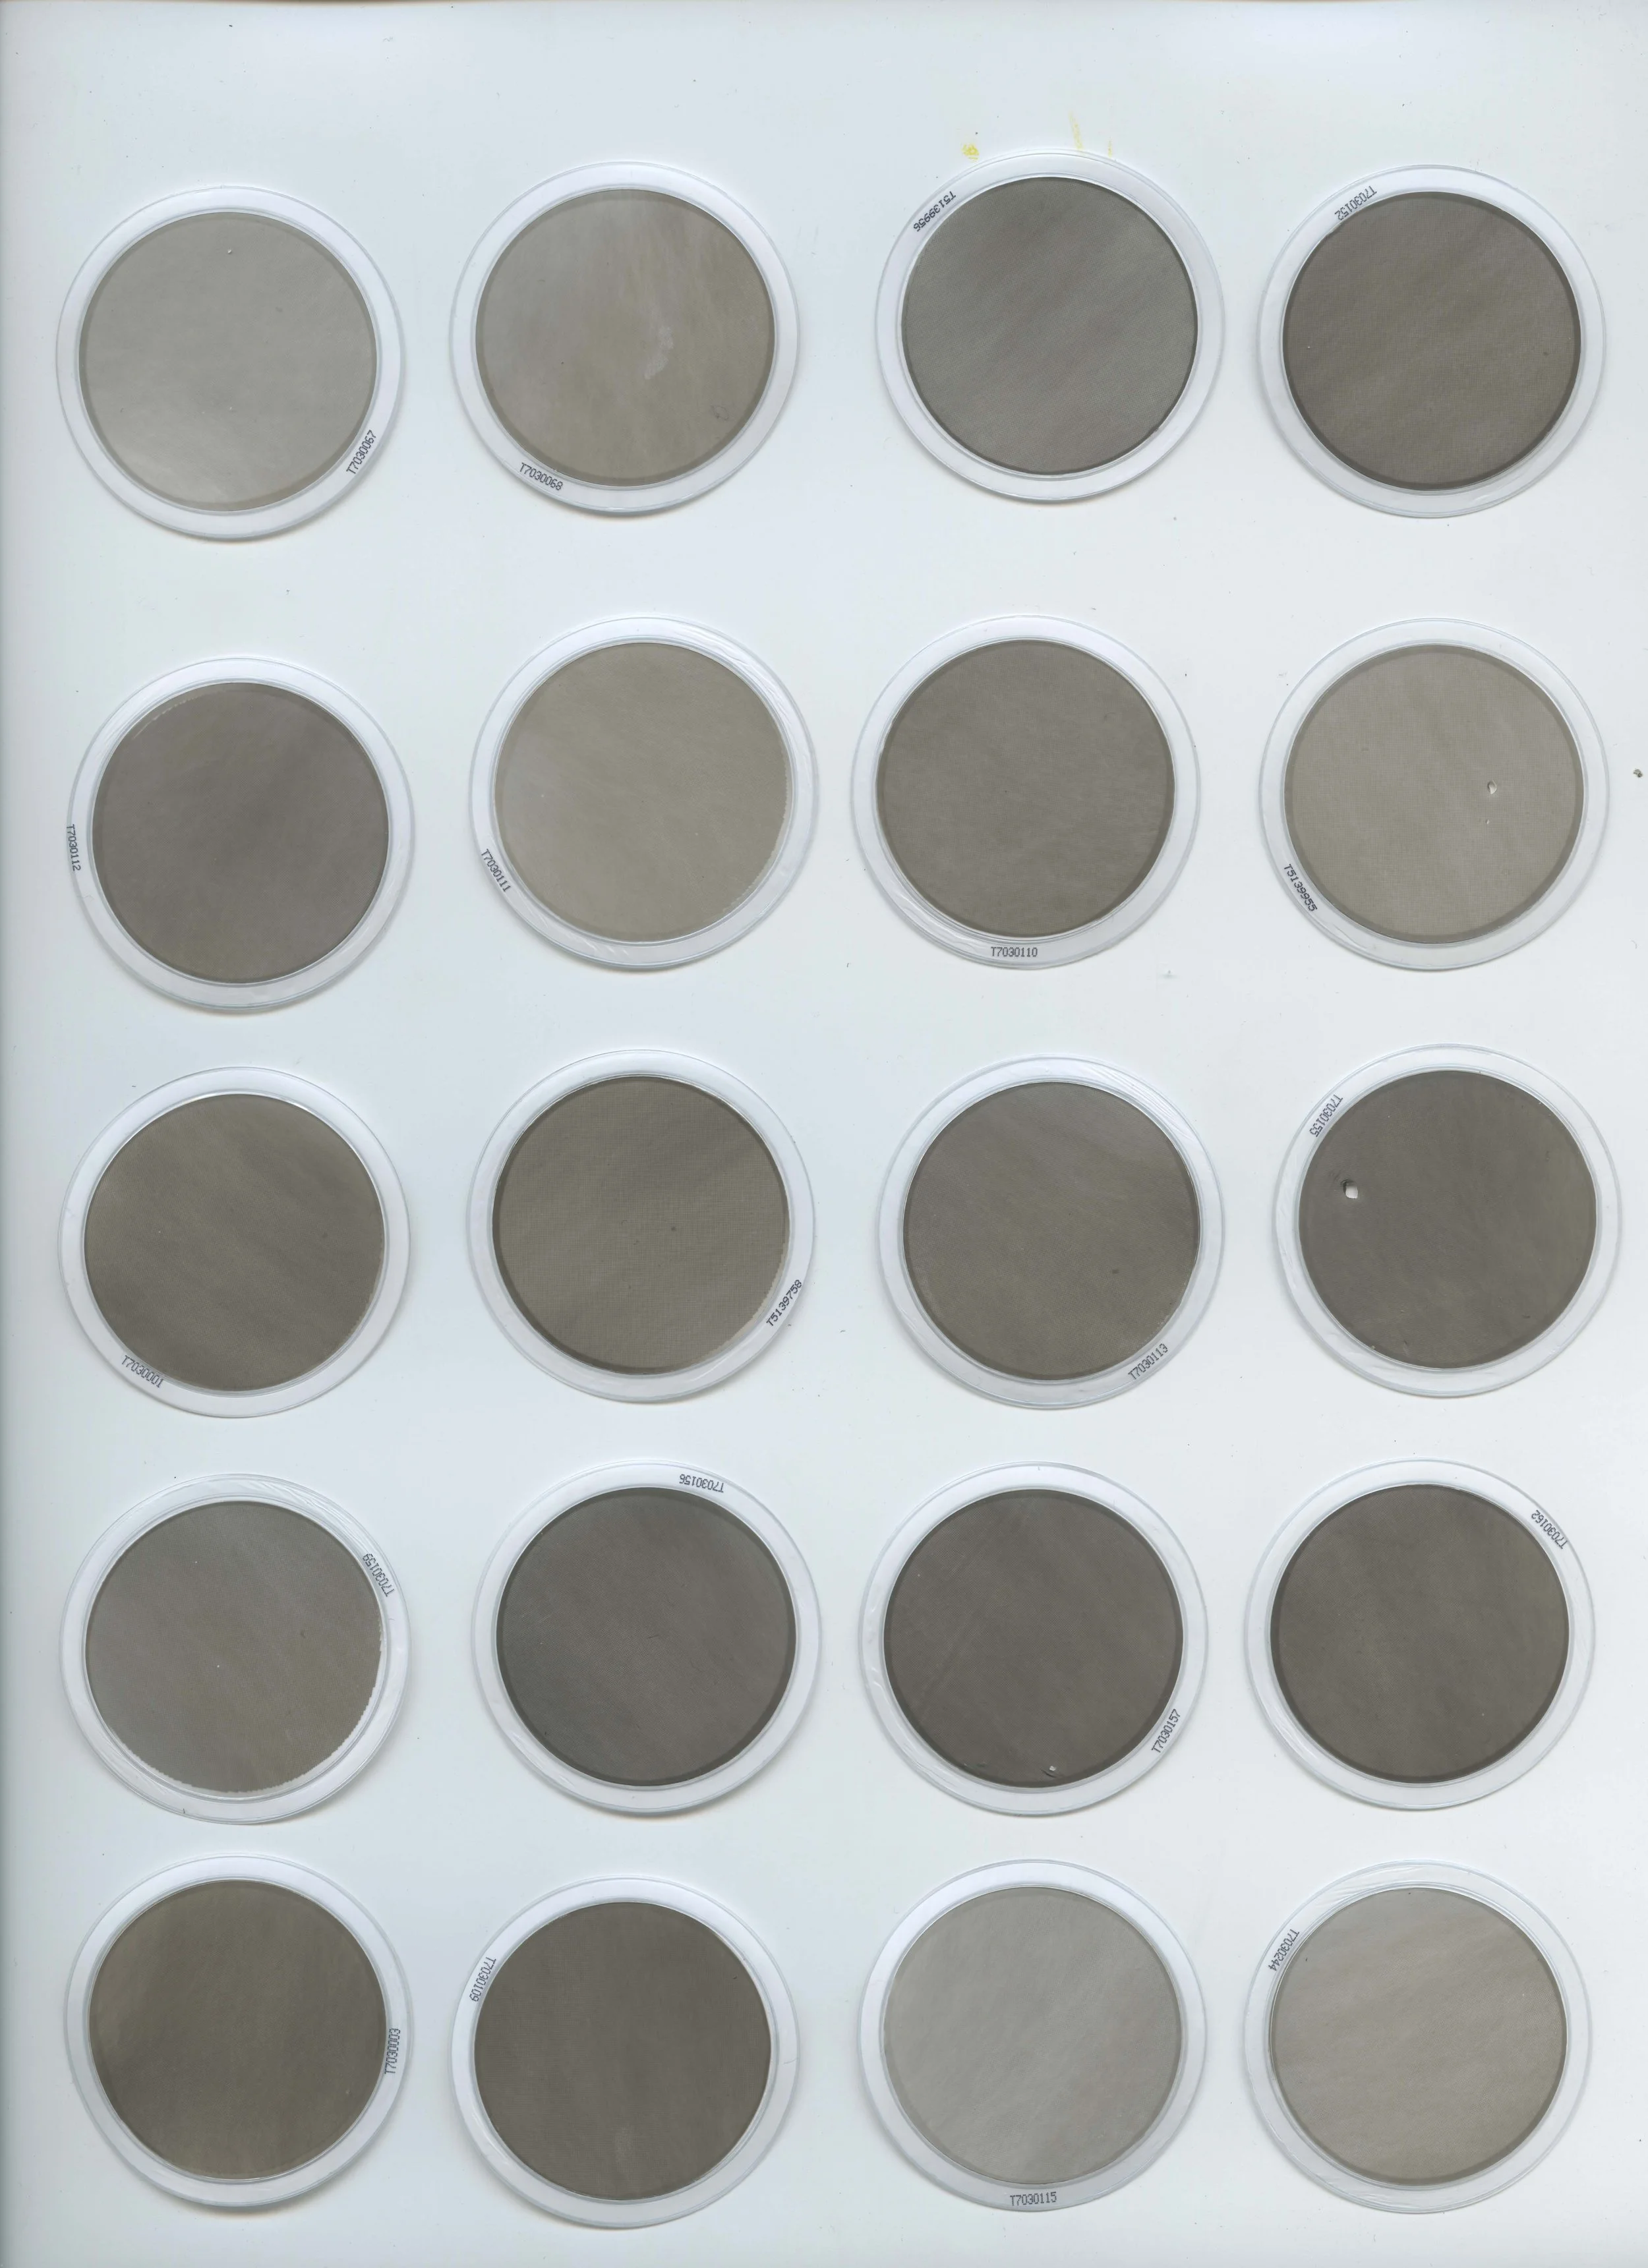
The Utah’s Department of Air Quality conducts daily air pollution recordings of PM 2.5 & 10 using gravimetric filters pulled through designated air pump instruments located around the Salt Lake Valley. Each filter is collected and weighted daily to determine the daily severity of PM 2.5 & 10. The filters appear as a range of light gray-brown to dark gray-brown, representing a tonal range 1-10 density.

I compiled the daily air pollution filter recordings to represent each month’s average PM 2.5 & 10 density and rendered a visualization of air pollution moving through the landscape using Adobe Photoshop & After Effects.
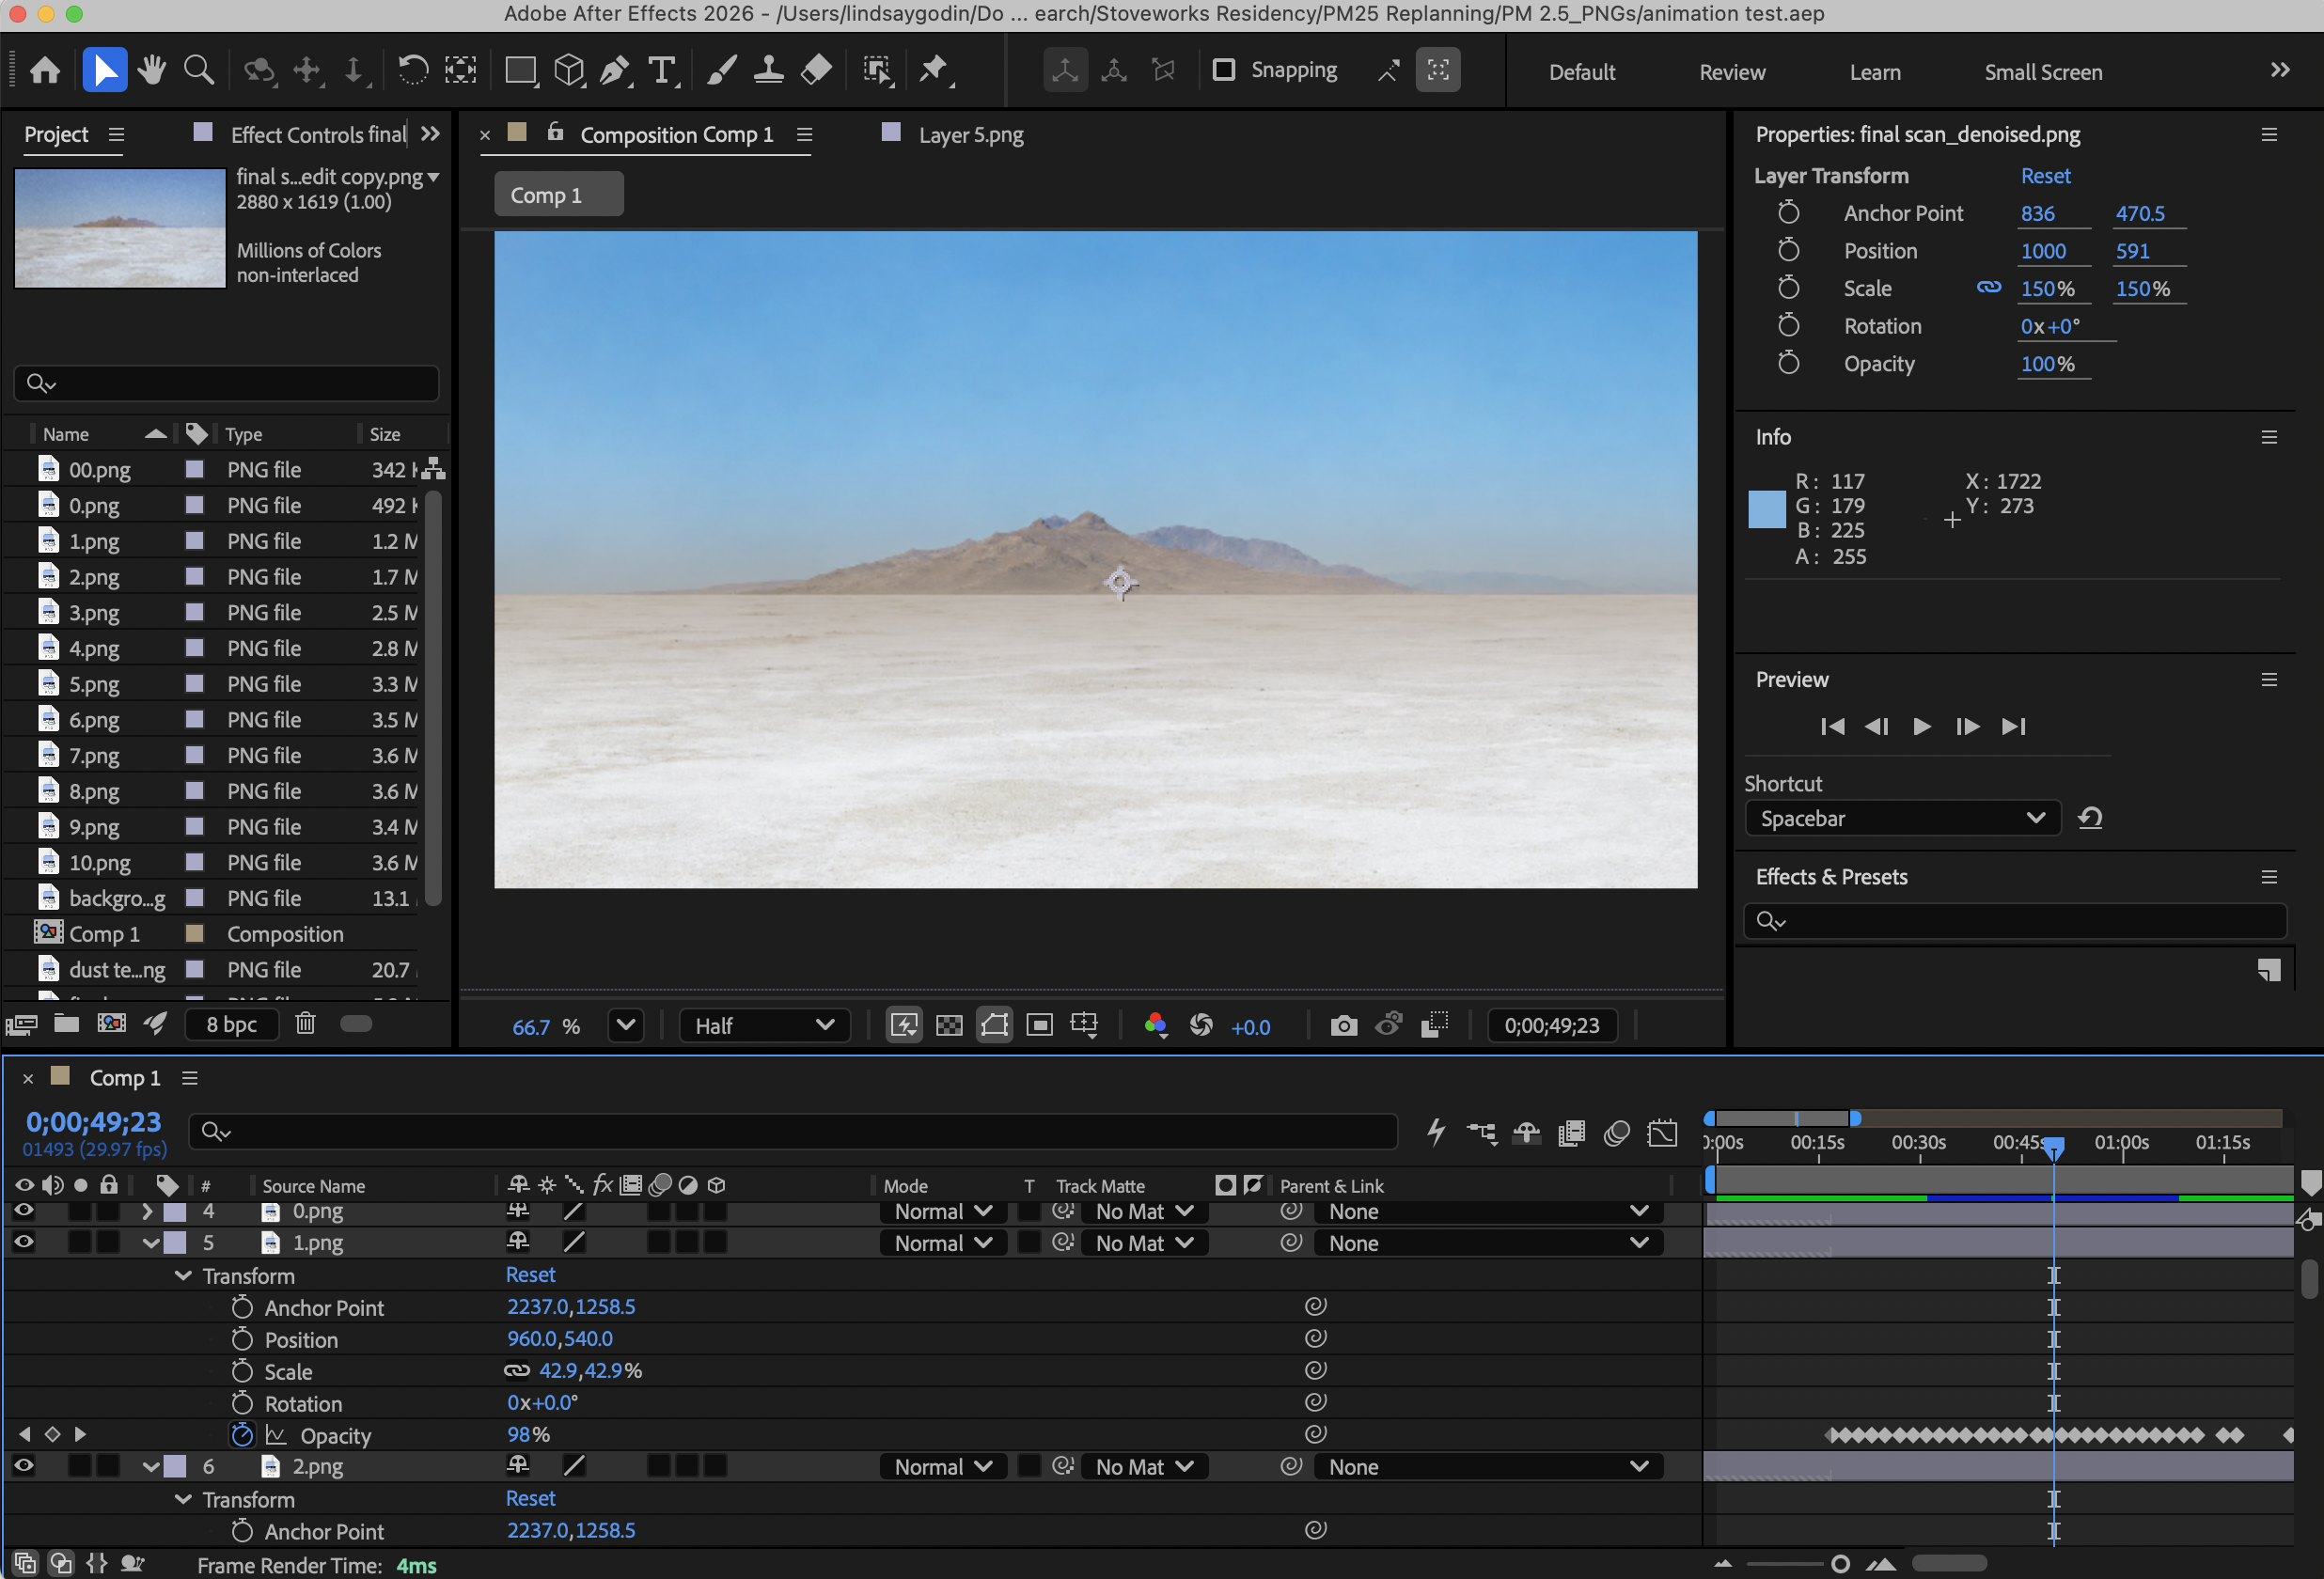
The background image and monthly renderings were compiled together in Adobe After Effects using animation keyframes and blending modes to visualize The Utah Department of Air Quality’s PM 2.5 & 10 data set from January 2014-December 2025.